Author: Olivia Zvara
June Data Drop: How We Use Google Rating to Assess Performance
June 16, 20252025 Revenue Opportunity Report
May 15, 2025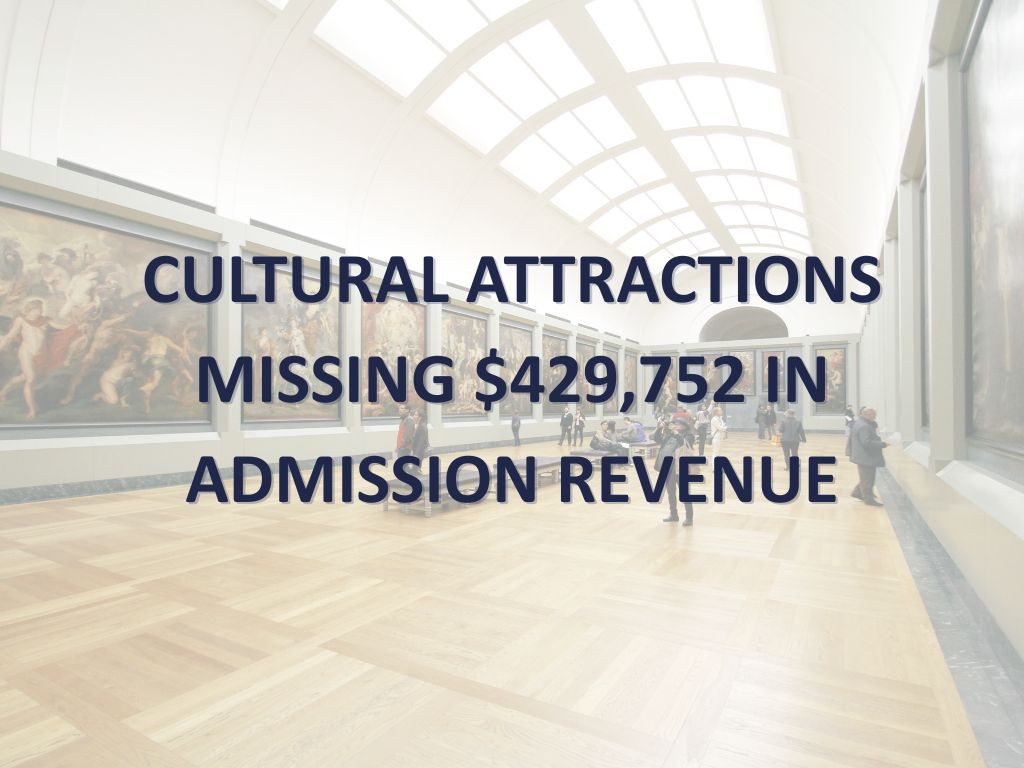
May Data Drop: Maximizing Admission Revenue
April 30, 20252024 Top 10 Natural History Museums
April 15, 2025Attendance isn’t the only metric that matters; market capture, admission price, and Google Rating are also Key Performance Indicators. These KPIs are connected. Our CompScore (a KPI index) identifies how a natural history museum performs in relation to 33 peer natural history museums in the 100 largest US markets. Congratulations to the natural history museums with Top 10 CompScores for 2024:
- American Museum of Natural History
- Smithsonian Museum of Natural History
- Mountain America Museum of Ancient Life
- Denver Museum of Nature and Science
- Houston Museum of Natural Science
- Field Museum of Natural History
- Perot Museum of Nature and Science
- The Bishop Museum of Science and Nature
- Carnegie Museum of Natural History
- Witte Museum
2024 Top 10 Children’s Museums
April 8, 2025Attendance isn’t the only metric that matters; market capture, admission price, and Google Rating are also Key Performance Indicators. These KPIs are connected. Our CompScore (a KPI index) identifies how a children’s museum performs in relation to 66 peer children’s museums in the 100 largest US markets. Congratulations to the children’s museums with Top 10 CompScores for 2024:
- Children’s Museum of Indianapolis
- The Strong National Museum of Play
- Omaha Children’s Museum
- Imagination Station
- Science City at Union Station
- EdVenture
- Louisiana Children’s Museum
- Marbles Kids Museum
- Mississippi Children’s Museum
- Creative Discovery Museum
2024 Top 10 Art Museums
April 7, 2025Attendance isn’t the only metric that matters; market capture, admission price, and Google Rating are also Key Performance Indicators. These KPIs are connected. Our CompScore (a KPI index) identifies how an art museum performs in relation to 190 peer art museums in the 100 largest US markets. Congratulations to the art museums with Top 10 CompScores for 2024:
- Metropolitan Museum of Art
- Museum of Modern Art
- National Gallery of Art
- Chihuly Garden and Glass
- Art Institute of Chicago
- Crystal Bridges Museum of American Art
- The John and Mable Ringling Museum of Art
- Milwaukee Art Museum
- Seattle Art Museum
- Philadelphia Museum of Art